Charts
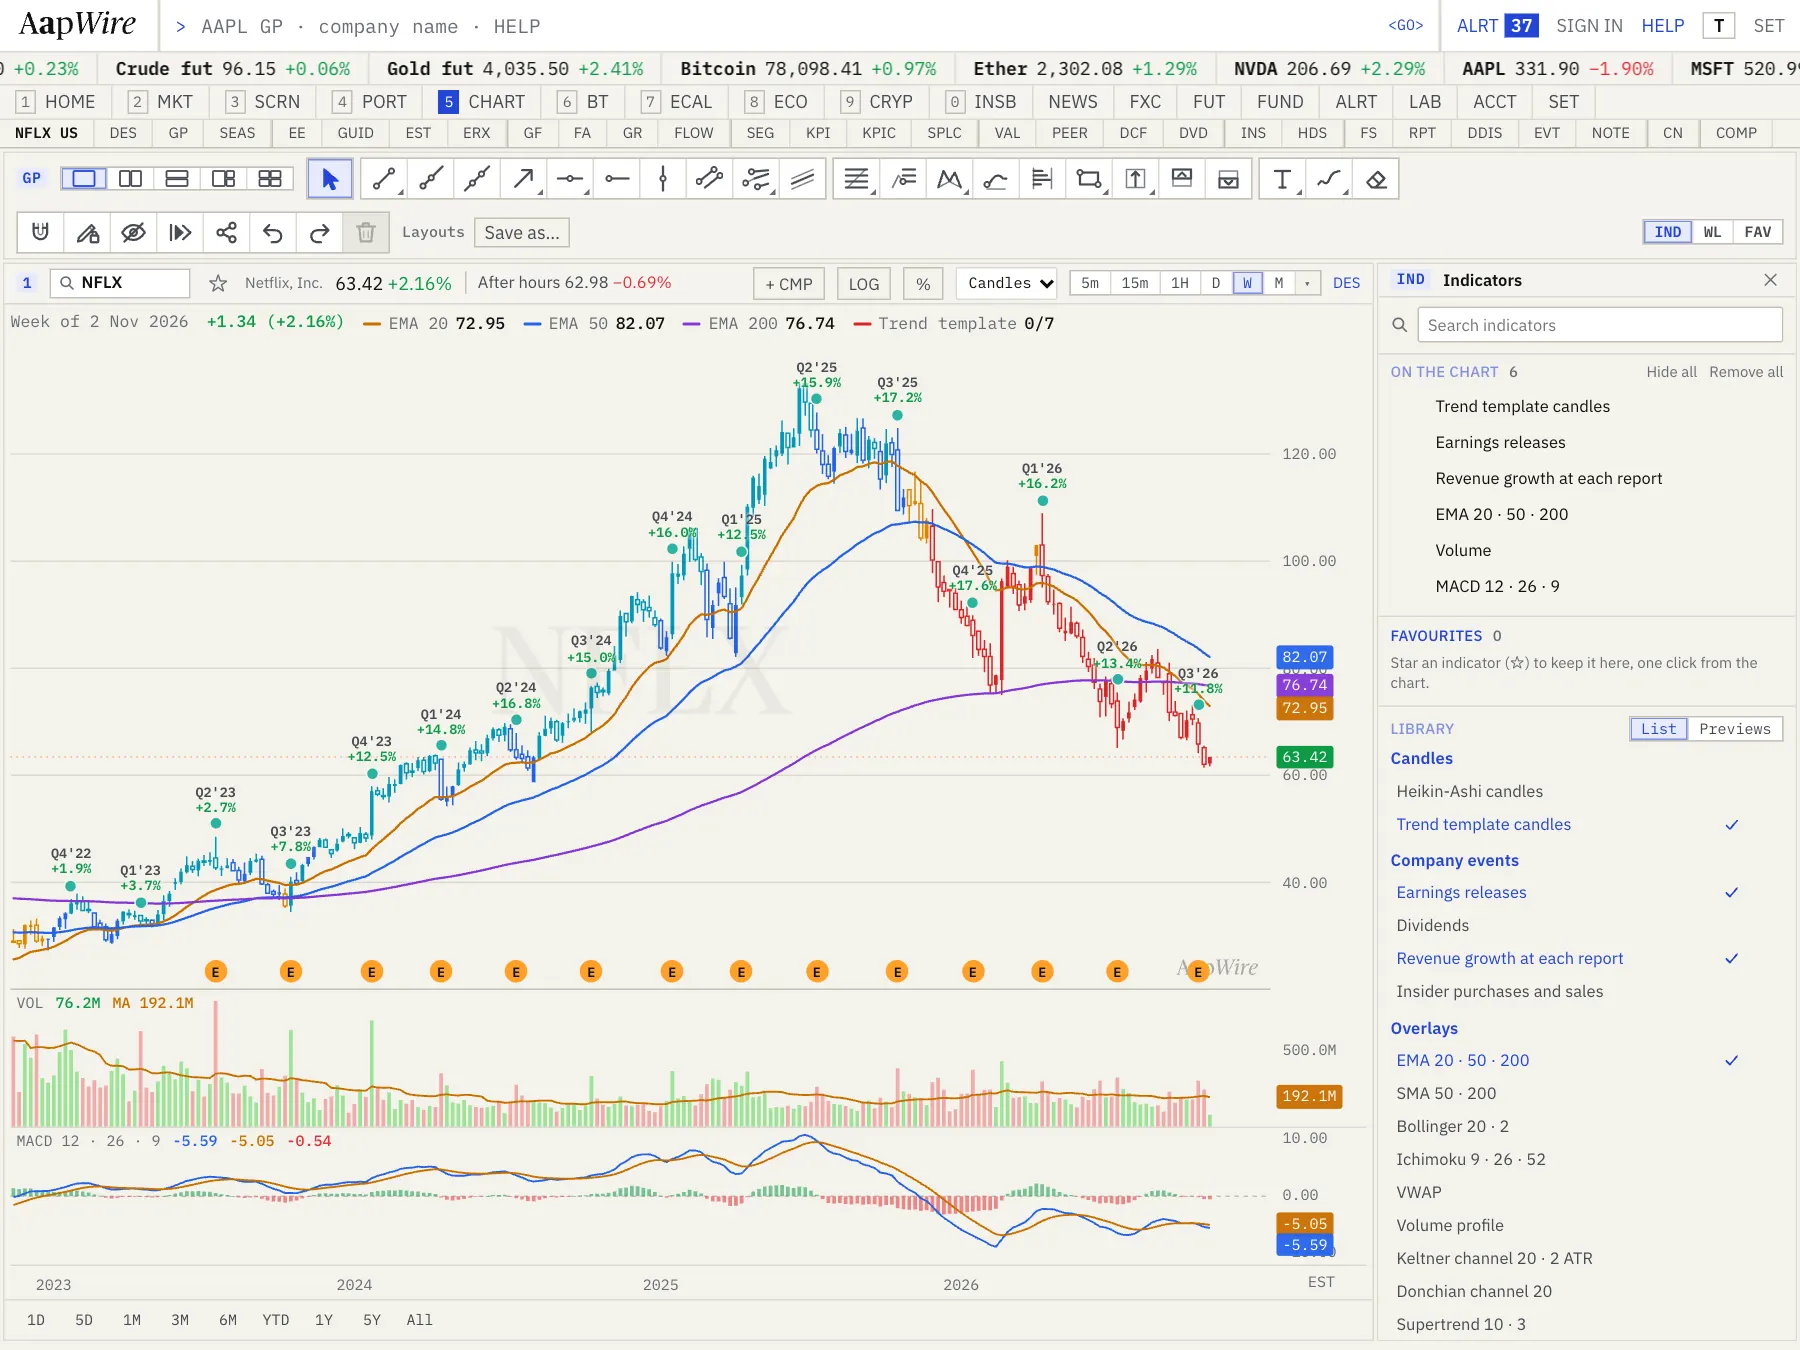
Price and fundamentals on one chart
A charting workspace whose studies are computed by AapWire Analytics, with each quarter's reported growth and the news plotted on the price.
- Runs on
- AapWire Filings Engine
- AapWire Analytics
Technical charting
Indicators stable across zoom levels, drawing tools and multi-chart layouts. Reported growth and headlines sit on the price axis, so a move and its cause read together.
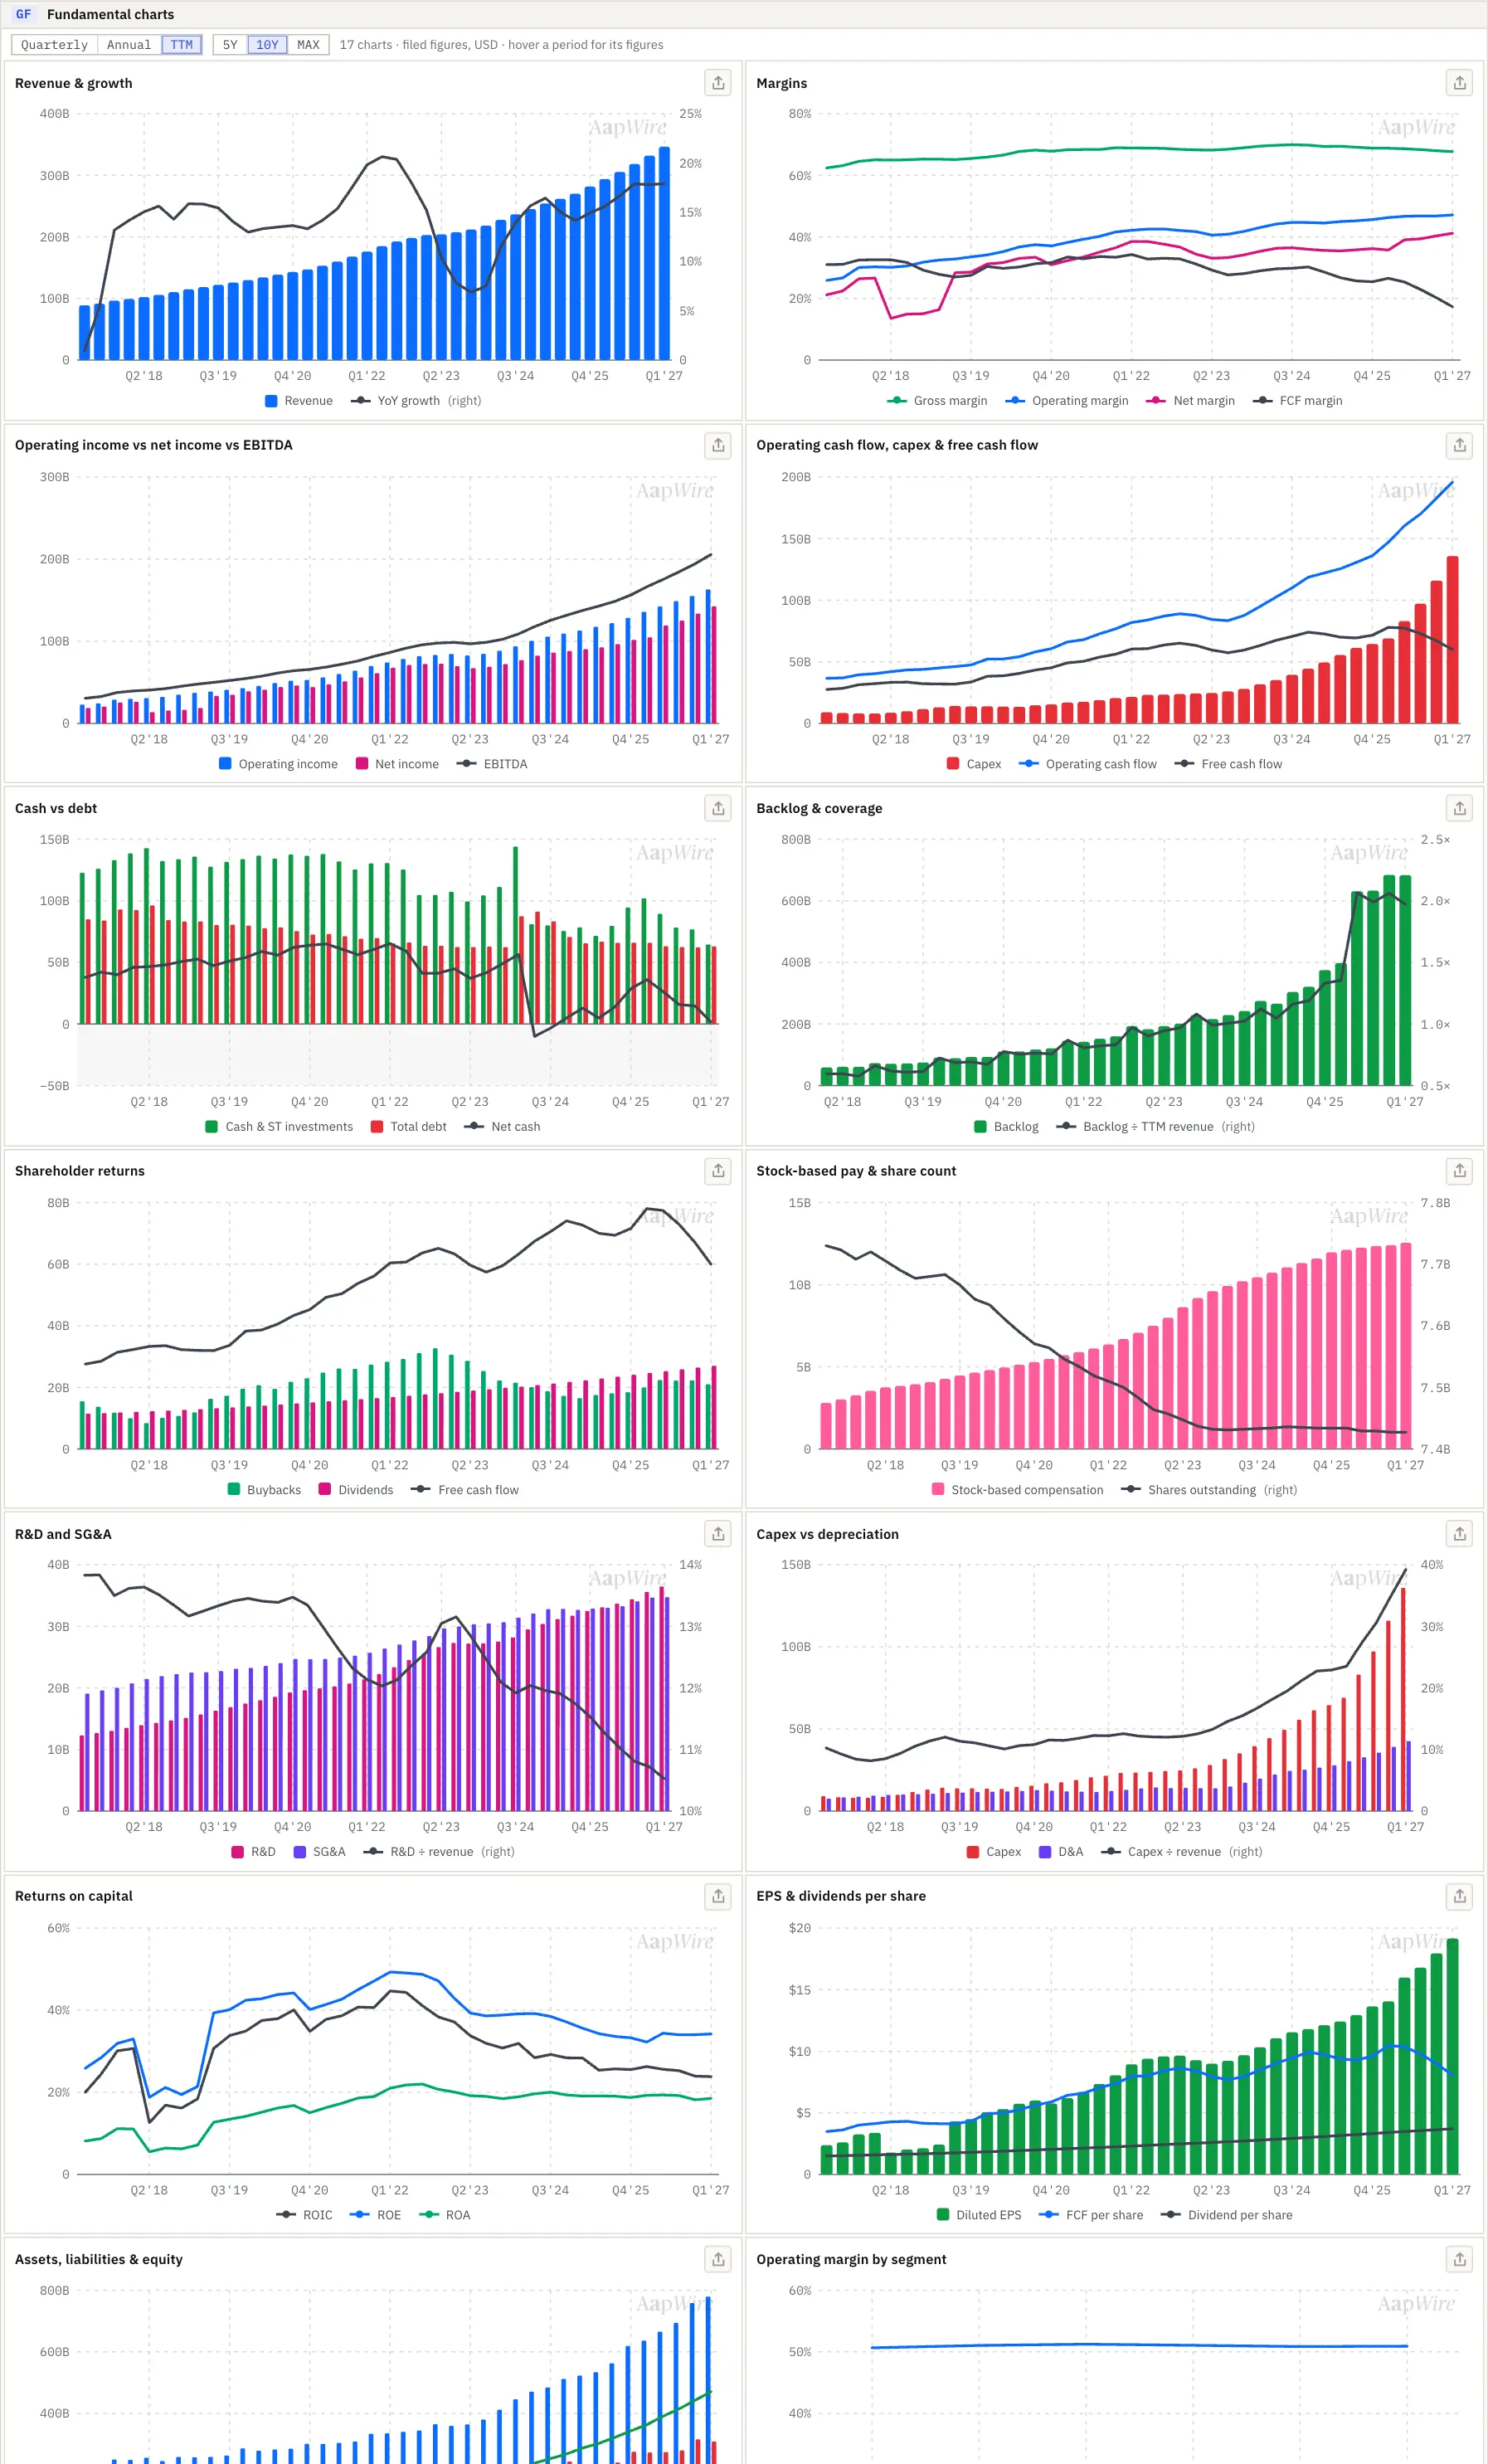
Fundamental charts
Ten years of revenue, margins, cash flow, returns and per-share series, and every operating KPI the company discloses.
Questions
How are indicators validated?
Each study is computed by AapWire Analytics and checked against reference implementations.
Are prices split-adjusted?
Yes. Price history is split-adjusted.
Also in the terminal
Company researchStandardised financials, operating KPIs, segments and valuation, reconciled to each filing.ScreenerMore than 5,000 US listings screened on reconciled fundamentals, multiples and technical signals.Earnings and guidanceEach print against expectations, the price reaction, and guidance tracked against delivery.Markets and economyIndices, rates, FX, the Fed path, breadth and the macro calendar.NewsA filtered wire of company, market and macro news, gathered into stories and tied to price.CryptoThe hundred largest coins with checked prices, ETF flows, protocol revenue and liquidation maps.Portfolio and alertsPerformance and risk against benchmarks from your ledger, watchlists and alerts.Research lab and backtestingMarket studies since 1950, event studies and rule backtests against buy-and-hold.
The whole terminal, one subscription.
Every part described here is included in both plans. Cancel at any time.